AHRI Releases December 2019 U.S. Heating and Cooling Equipment Shipment Data Residential Storage Water Heaters
2020-02-15
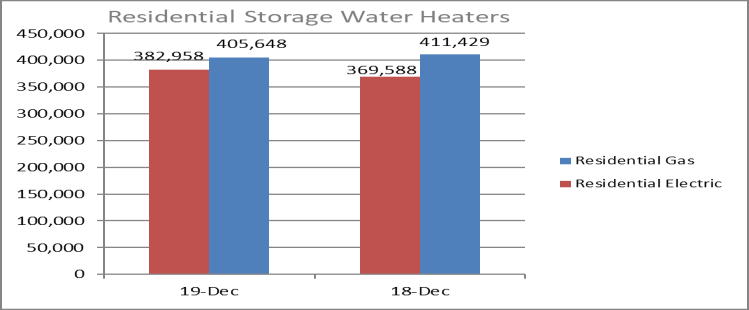
U.S. shipments of residential gas storage water heaters for December 2019 decreased 1.4 percent, to 405,648 units, down from 411,429 units shipped in December 2018. Residential electric storage water heater shipments increased 3.6 percent in December 2019 to 382,958 units, up from 369,588 units shipped in December 2018.
Year-to-date U.S. shipments of residential gas storage water heaters decreased 3.2 percent, to 4,377,001, compared to 4,521,373 shipped during that same period in 2018. Residential electric storage water heater shipments decreased 0.7 percent year-to-date, to 4,201,274 units, compared to 4,229,912 shipped during the same period in 2018.
Year-to-date U.S. shipments of residential gas storage water heaters decreased 3.2 percent, to 4,377,001, compared to 4,521,373 shipped during that same period in 2018. Residential electric storage water heater shipments decreased 0.7 percent year-to-date, to 4,201,274 units, compared to 4,229,912 shipped during the same period in 2018.
| Year-to-Date | |||
| Dec 19 YTD | Dec 18 YTD | %CHG. | |
| Residential Storage Gas | 4,377,001 | 4,521,373 | -3.2 |
| Residential Storage Electric | 4,201,274 | 4,229,912 | -0.7 |
Commercial Storage Water Heaters
Commercial gas storage water heater shipments decreased 11.1 percent in December 2019, to 7,272 units, down from 8,179 units shipped in December 2018. Commercial electric storage water heater shipments decreased 9.1 percent in December 2019, to 12,145 units, down from 13,359 units shipped in December 2018.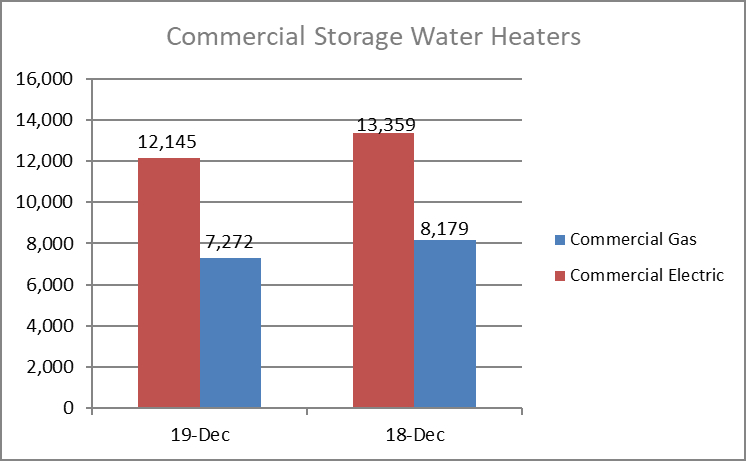
Year-to-date U.S. shipments of commercial gas storage water heaters decreased 6.3 percent, to 88,548 units, compared with 94,473 units shipped during the same period in 2018. Year-to-date commercial electric storage water heater shipments increased 9.2 percent, to 150,667 units, up from 137,937 units shipped during the same period in 2018.
| Year-to-Date | |||
| Dec 19 YTD | Dec 18 YTD | %Chg. | |
| Commercial Storage Gas | 88,548 | 94,473 | -6.3 |
| Commercial Storage Electric | 150,667 | 137,937 | +9.2 |
Warm Air Furnaces
U.S. shipments of gas warm air furnaces for December 2019 decreased 4.3 percent, to 287,599 units, down from 300,453 units shipped in December 2018. Oil warm air furnace shipments decreased 1.3 percent, to 5,023 units in December 2019, down from 5,087 units shipped in December 2018.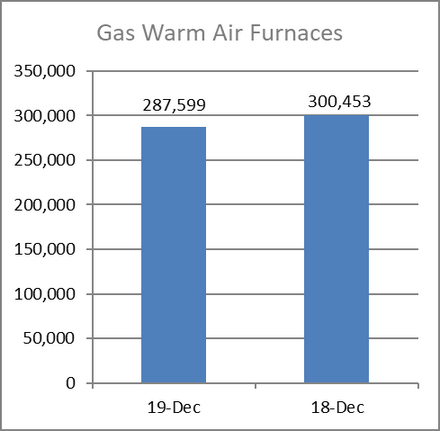
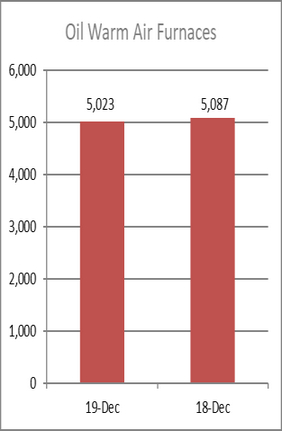
Year-to-date U.S. shipments of gas warm air furnaces increased 0.7 percent, to 3,441,872 units, compared with 3,416,571 units shipped during the same period in 2018. Year-to-date U.S. shipments of oil warm air furnaces increased 5.9 percent, to 40,692 units, compared with 38,429 units shipped during the same period in 2018.
| Year-to-Date | |||
| Dec 19 YTD | Dec 18 YTD | % Chg. | |
| Gas Warm Air Furnaces | 3,441,872 | 3,416,571 | +0.7 |
| Oil Warm Air Furnaces | 40,692 | 38,429 | +5.9 |
Central Air Conditioners and Air-Source Heat Pumps
U.S. shipments of central air conditioners and air-source heat pumps totaled 508,788 units in December 2019, up 3.4 percent from 491,986 units shipped in December 2018. U.S. shipments of air conditioners increased 3.9 percent, to 303,688 units, up from 292,320 units shipped in December 2018. U.S. shipments of air-source heat pumps increased 2.7 percent, to 205,100 units, up from 199,666 units shipped in December 2018.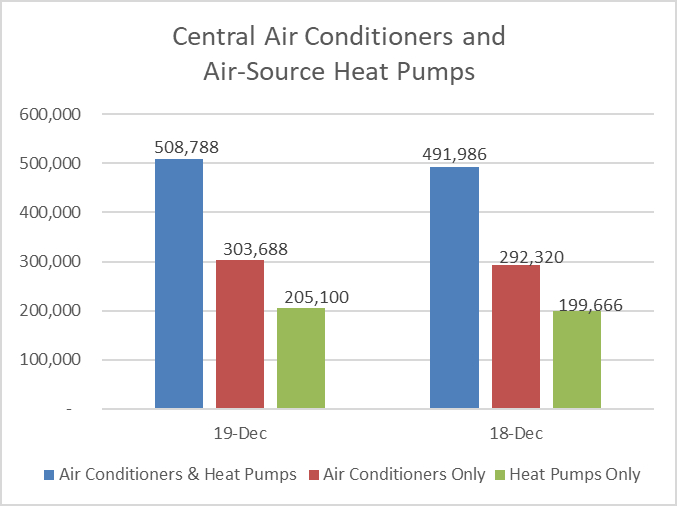
Year-to-date combined shipments of central air conditioners and air-source heat pumps increased 1.6 percent, to 8,469,615, up from 8,340,262 units shipped during the same period in 2018. Year-to-date shipments of central air conditioners decreased 0.7 percent, to 5,359,775 units, down from 5,399,760 units shipped during the same period in 2018. The year-to-date total for heat pump shipments increased 5.8 percent, to 3,109,840, up from 2,940,502 units shipped during the same period in 2018.
| Year-to-Date | |||
| Dec 19 YTD | Dec 18 YTD | % Chg. | |
| Air Conditioners & Heat Pumps | 8,469,615 | 8,340,262 | +1.6 |
| Air Conditioners Only | 5,359,775 | 5,399,760 | -0.7 |
| Heat Pumps Only | 3,109,840 | 2,940,502 | +5.8 |
U.S. Manufacturers’ Shipments of Central Air Conditioners and Air-Source Heat Pumps
| Month | ||
| Size Description (000) BTUH |
Total |
% Change from 2018 |
| Under 16.5 | 16,863 | -2.7 |
| 16.5-21.9 | 49,644 | +5.8 |
| 22-26.9 | 98,940 | +9.3 |
| 27-32.9 | 80,234 | +8.9 |
| 33-38.9 | 106,547 | +3.7 |
| 39-43.9 | 37,751 | -3.2 |
| 44-53.9 | 53,994 | -3.4 |
| 54-64.9 | 42,908 | -2.6 |
| 65-96.9 | 7,738 | -0.2 |
| 97-134.9 | 5,858 | -2.1 |
| 135-184.9 | 4,365 | +13.5 |
| 185-249.9 | 1,513 | -1.9 |
| 250-319.9 | 1,107 | -15.8 |
| 320-379.9 | 357 | +5.9 |
| 380-539.9 | 296 | -20.6 |
| 540-639.9 | 225 | -7.8 |
| 640-799.9 | 137 | +19.1 |
| 800.0-899.9 | 72 | |
| 900.0-999.9 | 98 | +25.6 |
| 1,000.0-1,199.9 | 44 | -6.4 |
| 1,200.0 & Over | 97 | +2.1 |
| TOTAL | 508,788 | +3.4 |
| YTD | ||
| Size Description (000) BTUH |
Total |
% Change from 2018 |
| Under 16.5 | 303,733 | +9.9 |
| 16.5-21.9 | 739,907 | +9.0 |
| 22-26.9 | 1,635,292 | +3.4 |
| 27-32.9 | 1,332,524 | +2.0 |
| 33-38.9 | 1,792,901 | +0.6 |
| 39-43.9 | 651,484 | -1.8 |
| 44-53.9 | 948,054 | -2.1 |
| 54-64.9 | 757,301 | -2.1 |
| 65-96.9 | 109,606 | -0.3 |
| 97-134.9 | 83,717 | -0.6 |
| 135-184.9 | 56,986 | -1.0 |
| 185-249.9 | 25,109 | +1.8 |
| 250-319.9 | 16,054 | -4.7 |
| 320-379.9 | 4,222 | +0.4 |
| 380-539.9 | 4,393 | +1.6 |
| 540-639.9 | 3,117 | -8.5 |
| 640-799.9 | 1,631 | +11.3 |
| 800.0-899.9 | 841 | +1.7 |
| 900.0-999.9 | 824 | -7.9 |
| 1,000.0-1,199.9 | 525 | +0.6 |
| 1,200.0 & Over | 1,394 | +35.7 |
| TOTAL | 8,469,615 | +1.6 |
BTUHs of 64.9 and below are for residential units; 65.0 and above for commercial.
NOTE: A shipment is defined as when a unit transfers ownership; a consignment is not a transfer of ownership. Industry data is aggregated from the information supplied by AHRI member companies that participate in the statistics program and can be subject to revision. Published year-to-date data is inclusive of all revisions. No other AHRI data (e.g., by state or region) is available to the general public other than that published. AHRI does not conduct any market forecasting and is not qualified to discuss market trends. For previous monthly shipment releases and historical data, please
see http://www.ahrinet.org/statistics.