
AHRI Releases September 2020 U.S. Heating and Cooling Equipment Shipment Data
2020-11-14
13 November 2020
Residential Storage Water Heaters
U.S. shipments of residential gas storage water heaters for September 2020 increased 10.7 percent, to 366,161 units, up from 330,910 units shipped in September 2019. Residential electric storage water heater shipments increased 18.3 percent in September 2020 to 383,178 units, up from 323,984 units shipped in September 2019.
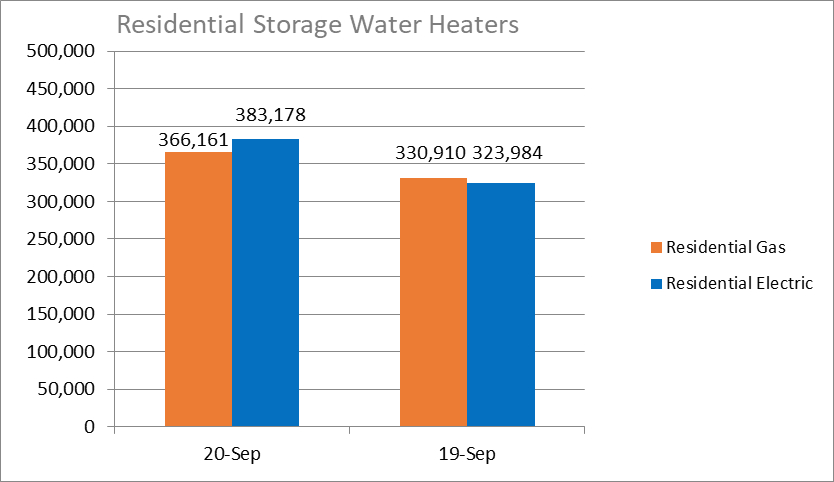
Year-to-date U.S. shipments of residential gas storage water heaters increased 2.7 percent, to 3,377,667 compared to 3,288,163 shipped during that same period in 2019. Residential electric storage water heater shipments increased 8.9 percent year-to-date, to 3,402,457 units, compared to 3,124,601 shipped during the same period in 2019.
Residential Storage Water Heaters
U.S. shipments of residential gas storage water heaters for September 2020 increased 10.7 percent, to 366,161 units, up from 330,910 units shipped in September 2019. Residential electric storage water heater shipments increased 18.3 percent in September 2020 to 383,178 units, up from 323,984 units shipped in September 2019.
Year-to-date U.S. shipments of residential gas storage water heaters increased 2.7 percent, to 3,377,667 compared to 3,288,163 shipped during that same period in 2019. Residential electric storage water heater shipments increased 8.9 percent year-to-date, to 3,402,457 units, compared to 3,124,601 shipped during the same period in 2019.
| Year-to-Date | |||
| Sep 20 YTD | Sep 19 YTD | %CHG. | |
| Residential Storage Gas | 3,377,667 | 3,288,163 | +2.7 |
| Residential Storage Electric | 3,402,457 | 3,124,601 | +8.9 |
Commercial Storage Water Heaters
Commercial gas storage water heater shipments decreased 15.9 percent in September 2020, to 6,455 units, down from 7,672 units shipped in September 2019. Commercial electric storage water heater shipments decreased 2.2 percent in September 2020, to 11,325 units, down from 11,578 units shipped in September 2019.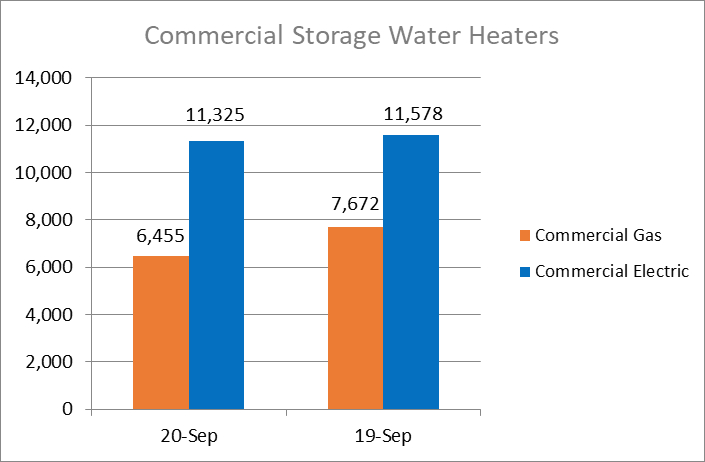
Year-to-date U.S. shipments of commercial gas storage water heaters decreased 14.3 percent, to 58,585 units, compared with 68,359 units shipped during the same period in 2019. Year-to-date commercial electric storage water heater shipments decreased 8.6 percent, to 104,720 units, down from 114,590 units shipped during the same period in 2019.
| Year-to-Date | |||
| Sep 20 YTD | Sep 19 YTD | %CHG. | |
| Commercial Storage Gas | 58,585 | 68,359 | -14.3 |
| Commercial Storage Electric | 104,720 | 114,590 | -8.6 |
Warm Air Furnaces
U.S. shipments of gas warm air furnaces for September 2020 increased 22.4 percent, to 351,087 units, up from 286,870 units shipped in September 2019. Oil warm air furnace shipments increased 8 percent, to 5,388 units in September 2020, up from 4,987 units shipped in September 2019.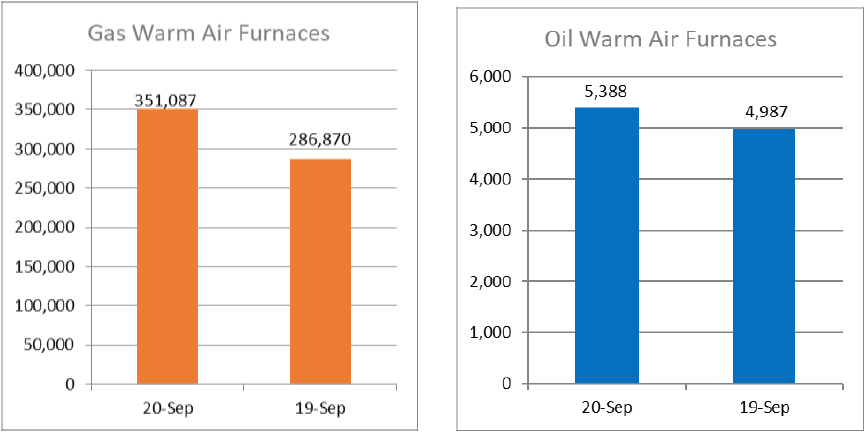
Year-to-date U.S. shipments of gas warm air furnaces decreased 9.7 percent, to 2,329,809 units, compared with 2,578,687 units shipped during the same period in 2019. Year-to-date U.S. shipments of oil warm air furnaces decreased 15.5 percent, to 22,768 units, compared with 26,936 units shipped during the same period in 2019.
| Year-to-Date | |||
| Sep 20 YTD | Sep 19 YTD | %CHG. | |
| Gas Warm Air Furnaces | 2,329,809 | 2,578,687 | -9.7 |
| Oil Warm Air Furnaces | 22,768 | 26,936 | -15.5 |
Central Air Conditioners and Air-Source Heat Pumps
U.S. shipments of central air conditioners and air-source heat pumps totaled 902,546 units in September 2020, up 47.1 percent from 613,607 units shipped in September 2019. U.S. shipments of air conditioners increased50.7 percent, to 573,565 units, up from 380,581 units shipped in September 2019. U.S. shipments of air- source heat pumps increased 41.2 percent, to 328,981 units, up from 233,026 units shipped in September 2019.
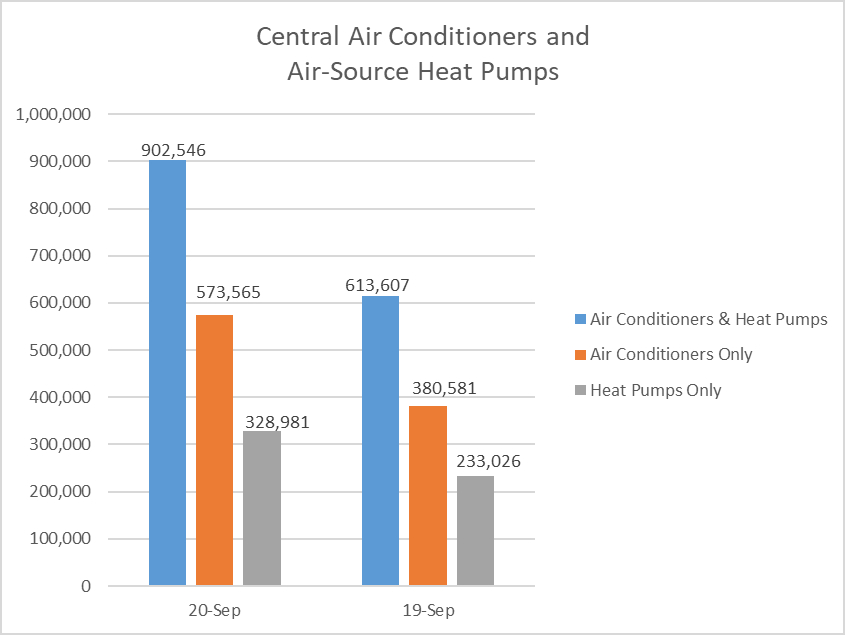
Year-to-date combined shipments of central air conditioners and air-source heat pumps increased 5.1 percent, to 7,338,953 units, up from 6,984,349 units shipped during the same period in 2019. Year-to-date shipments of central air conditioners increased 6.1 percent, to 4,744,384 units, up from 4,472,595 units shipped during the same period in 2019. The year-to-date total for heat pump shipments increased 3.3 percent, to 2,594,569, up from 2,511,754 units shipped during the same period in 2019.
| Year-to-Date | |||
| Sep 20 YTD | Sep 19 YTD | %CHG. | |
| Air Conditioners & Heat Pumps Combined Total | 7,338,953 | 6,984,349 | +5.1 |
| Air Conditioners Only | 4,744,384 | 4,472,595 | +6.1 |
| Heat Pumps Only | 2,594,569 | 2,511,754 | +3.3 |
U.S. Manufacturers’ Shipments of Central Air Conditioners and Air-Source Heat Pumps
| Month | ||
| Size Description (000) BTUH |
Total |
% Change from 2019 |
| Under 16.5 | 33,611 | +56.0 |
| 16.5-21.9 | 86,942 | +58.7 |
| 22-26.9 | 176,908 | +59.0 |
| 27-32.9 | 146,430 | +65.1 |
| 33-38.9 | 184,744 | +46.8 |
| 39-43.9 | 71,585 | +49.6 |
| 44-53.9 | 100,572 | +36.1 |
| 54-64.9 | 78,270 | +24.1 |
| 65-96.9 | 8,364 | -9.0 |
| 97-134.9 | 6,187 | -12.8 |
| 135-184.9 | 4,368 | -13.2 |
| 185-249.9 | 1,826 | -26.3 |
| 250-319.9 | 1,445 | -1.8 |
| 320-379.9 | 335 | -8.0 |
| 380-539.9 | 342 | -6.0 |
| 540-639.9 | 251 | +10.1 |
| 640-799.9 | 116 | -20.5 |
| 800.0-899.9 | 61 | -18.7 |
| 900.0-999.9 | 70 | +79.5 |
| 1,000.0-1,199.9 | 53 | +39.5 |
| 1,200.0 & Over | 66 | -48.0 |
| TOTAL | 902,546 | +47.1 |
| YTD | ||
| Size Description (000) BTUH |
Total |
% Change from 2019 |
| Under 16.5 | 266,224 | +10.0 |
| 16.5-21.9 | 663,131 | +11.3 |
| 22-26.9 | 1,460,174 | +7.8 |
| 27-32.9 | 1,196,869 | +7.9 |
| 33-38.9 | 1,576,326 | +5.8 |
| 39-43.9 | 563,650 | +4.2 |
| 44-53.9 | 810,729 | +3.0 |
| 54-64.9 | 601,949 | -3.6 |
| 65-96.9 | 70,994 | -17.5 |
| 97-134.9 | 52,336 | -20.7 |
| 135-184.9 | 35,708 | -18.9 |
| 185-249.9 | 15,880 | -19.4 |
| 250-319.9 | 12,697 | +0.8 |
| 320-379.9 | 3,075 | -1.2 |
| 380-539.9 | 3,093 | -8.8 |
| 540-639.9 | 2,443 | +1.2 |
| 640 & Over | 1,070 | -10.8 |
| 800.0-899.9 | 641 | +4.1 |
| 900.0-999.9 | 691 | +15.4 |
| 1,000.0-1,199.9 | 467 | +15.6 |
| 1,200.0 & Over | 806 | -24.3 |
| TOTAL | 7,338,953 | +5.1 |
BTUHs of 64.9 and below are for residential units; 65.0 and above for commercial.
NOTE: A shipment is defined as when a unit transfers ownership; a consignment is not a transfer of ownership. Industry data is aggregated from the information supplied by AHRI member companies that participate in the statistics program and can be subject to revision. Published year-to-date data is inclusive of all revisions. No other AHRI data (e.g., by state or region) is available to the general public other than that published. AHRI does not conduct any market forecasting and is not qualified to discuss market trends. For previous monthly shipment releases and historical data, please
see http://www.ahrinet.org/statistics.