
AHRI Releases August 2021 U.S. Heating and Cooling Equipment Shipment Data
2021-10-07
6 October 2021
Residential Storage Water Heaters
U.S. shipments of residential gas storage water heaters for August 2021 decreased 3.7 percent, to 385,849 units, down from 400,862 units shipped in August 2020. Residential electric storage water heater shipments decreased 4.2 percent in August 2021 to 377,974 units, down from 394,585 units shipped in August 2020.
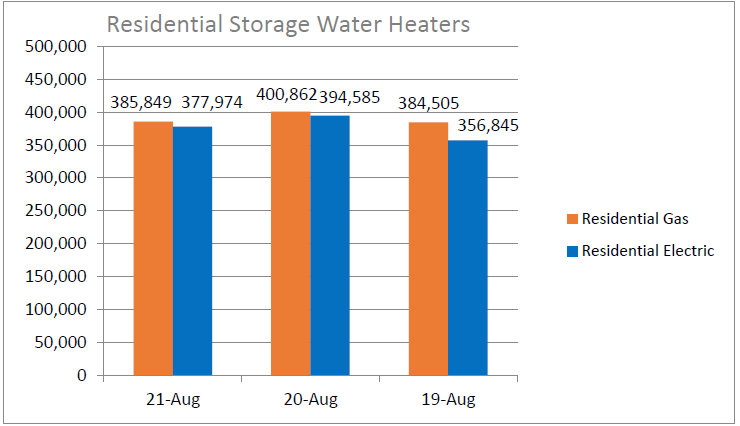
Year-to-date U.S. shipments of residential gas storage water heaters increased 8.3 percent, to 3,261,502 compared to 3,011,506 shipped during that same period in 2020. Residential electric storage water heater shipments increased 7.2 percent year-to-date, to 3,236,210 units, compared to 3,019,279 shipped during the same period in 2020.
Residential Storage Water Heaters
U.S. shipments of residential gas storage water heaters for August 2021 decreased 3.7 percent, to 385,849 units, down from 400,862 units shipped in August 2020. Residential electric storage water heater shipments decreased 4.2 percent in August 2021 to 377,974 units, down from 394,585 units shipped in August 2020.
Year-to-date U.S. shipments of residential gas storage water heaters increased 8.3 percent, to 3,261,502 compared to 3,011,506 shipped during that same period in 2020. Residential electric storage water heater shipments increased 7.2 percent year-to-date, to 3,236,210 units, compared to 3,019,279 shipped during the same period in 2020.
| Year-to-Date | ||||
| Aug 21 YTD | Aug 20 YTD | %CHG. (From 2020-2021) | Aug 19 YTD | |
| Residential Storage Gas | 3,261,502 | 3,011,506 | +8.3 | 2,957,253 |
| Residential Storage Electric | 3,236,210 |
3,019,279 |
+7.2 |
2,800,617 |
Commercial Storage Water Heaters
Commercial gas storage water heater shipments increased 36.2 percent in August 2021, to 7,615 units, up from 5,592 units shipped in August 2020. Commercial electric storage water heater shipments increased 27.8 percent in August 2021, to 14,283 units, up from 11,177 units shipped in August 2020.
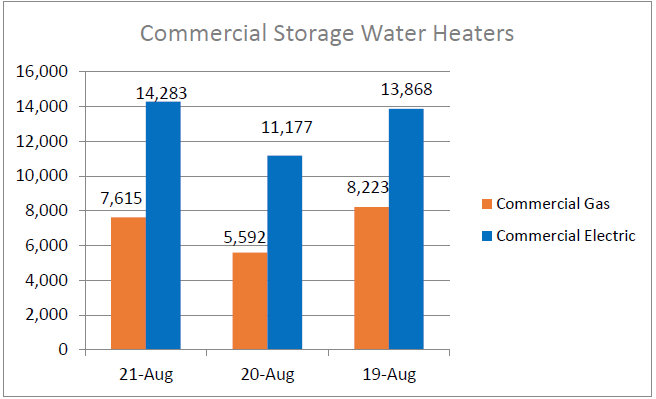
Year-to-date U.S. shipments of commercial gas storage water heaters increased 17.9 percent, to 61,473 units, compared with 52,130 units shipped during the same period in 2020. Year-to-date commercial electric storage water heater shipments increased 9.0 percent, to 101,756 units, up from 93,395 units shipped during the same period in 2020.
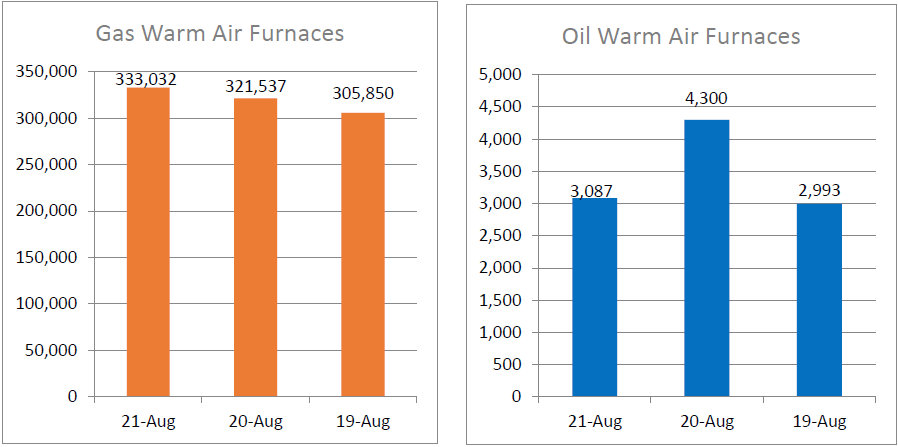
Warm Air Furnaces
U.S. shipments of gas warm air furnaces for August 2021 increased 3.6 percent, to 333,032 units, up from 321,537 units shipped in August 2020. Oil warm air furnace shipments decreased 28.2 percent, to 3,087 units in August 2021, down from 4,300 units shipped in August 2020.
Commercial gas storage water heater shipments increased 36.2 percent in August 2021, to 7,615 units, up from 5,592 units shipped in August 2020. Commercial electric storage water heater shipments increased 27.8 percent in August 2021, to 14,283 units, up from 11,177 units shipped in August 2020.
Year-to-date U.S. shipments of commercial gas storage water heaters increased 17.9 percent, to 61,473 units, compared with 52,130 units shipped during the same period in 2020. Year-to-date commercial electric storage water heater shipments increased 9.0 percent, to 101,756 units, up from 93,395 units shipped during the same period in 2020.
| Year-to-Date | ||||
| Aug 21 YTD | Aug 20 YTD | %CHG. (From 2020-2021) | Aug 19 YTD | |
| Commercial Storage Gas | 61,473 | 52,130 | +17.9 | 60,687 |
| Commercial Storage Electric | 101,756 | 93,395 | +9.0 | 103,012 |
Warm Air Furnaces
U.S. shipments of gas warm air furnaces for August 2021 increased 3.6 percent, to 333,032 units, up from 321,537 units shipped in August 2020. Oil warm air furnace shipments decreased 28.2 percent, to 3,087 units in August 2021, down from 4,300 units shipped in August 2020.
Year-to-date U.S. shipments of gas warm air furnaces increased 35.4 percent, to 2,679,872 units, compared with 1,978,722 units shipped during the same period in 2020. Year-to-date U.S. shipments of oil warm air furnaces increased 29.5 percent, to 22,511 units, compared with 17,380 units shipped during the same period in 2020.
| Year-to-Date | ||||
| Aug 21 YTD | Aug 20 YTD | %CHG. (From 2020-2021) | Aug 19 YTD | |
| Gas Warm Air Furnaces | 2,679,872 | 1,978,722 | +35.4 | 2,291,817 |
| Oil Warm Air Furnaces | 22,511 | 17,380 | +29.5 | 21,949 |
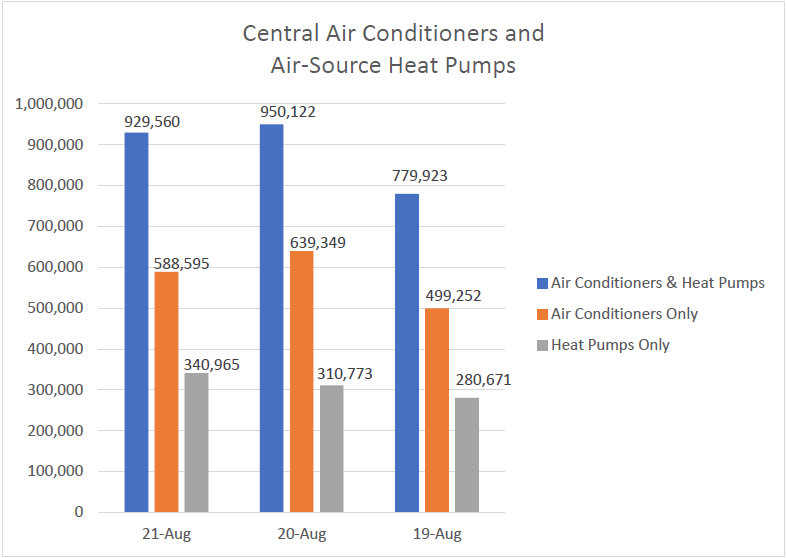
Central Air Conditioners and Air-Source Heat Pumps
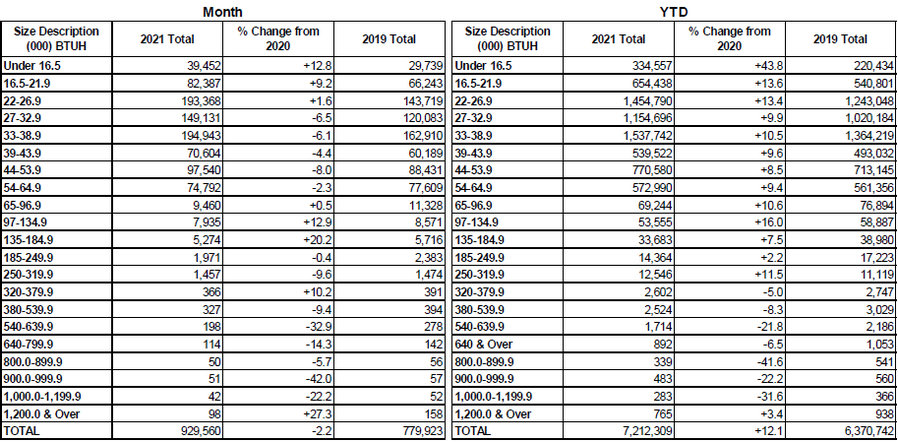
U.S. shipments of central air conditioners and air-source heat pumps totaled 929,560 units in August 2021, down 2.2 percent from 950,122 units shipped in August 2020. U.S. shipments of air conditioners decreased 7.9 percent, to 588,595 units, down from 639,349 units shipped in August 2020. U.S. shipments of air-source heat pumps increased 9.7 percent, to 340,965 units, up from 310,773 units shipped in August 2020.
Year-to-date combined shipments of central air conditioners and air-source heat pumps increased 12.1 percent, to 7,212,309 units, up from 6,436,407 units shipped during the same period in 2020. Year-to-date shipments of central air conditioners increased 7.4 percent, to 4,480,831 units, up from 4,170,819 units shipped during the same period in 2020. The year-to-date total for heat pump shipments increased 20.6 percent, to 2,731,478, up from 2,265,588 units shipped during the same period in 2020.
| Year-to-Date | ||||
| Aug 21 YTD | Aug 20 YTD | %CHG. (From 2020- 2021) |
Aug 19 YTD | |
| Air Conditioners & Heat Pumps Combined Total | 7,212,309 | 6,436,407 | +12.1 | 6,370,742 |
| Air Conditioners Only | 4,480,831 | 4,170,819 | +7.4 | 4,092,014 |
| Heat Pumps Only | 2,731,478 | 2,265,588 | +20.6 | 2,278,728 |
U.S. Manufacturers’ Shipments of Central Air Conditioners and Air-Source Heat Pumps
Notes and FAQs
A shipment is defined as when a unit transfers ownership; a consignment is not a transfer of ownership. Industry data is aggregated from the information supplied by AHRI member companies that participate in the statistics program and can be subject to revision. Published year-to-date data is inclusive of all revisions. No other AHRI data (e.g., by state or region) is available to the public other than that published. AHRI does not conduct any market forecasting and is not qualified to discuss market trends. BTUHs of 64.9 and below are for residential units; 65.0 and above for commercial.
For previous monthly shipment releases and historical data, please see http://www.ahrinet.org/statistics.